Residents Salary & Debt Report 2015: Are Residents Happy?
Neil Chesanow | July 22, 2015
| 1 | of | 34 |
- Contributor Information
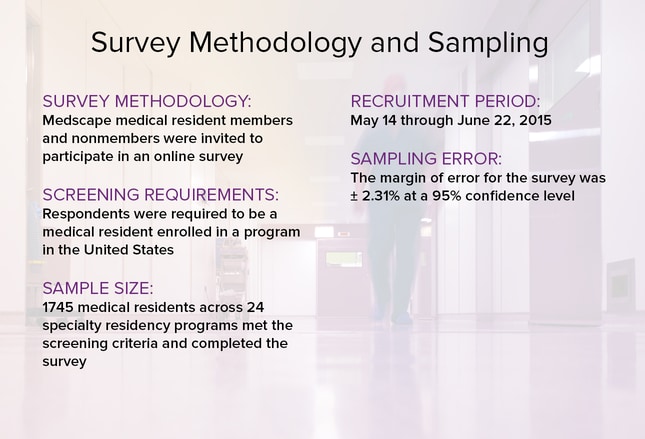
How much do residents earn? Do they feel fairly compensated? How much debt do they have? What about the hours they work, their professional relationships, the quality of education they are receiving, and their ability to maintain a healthy work-life balance? For answers, Medscape surveyed more than 1700 residents in 24 specialties to take part in an online survey from May 14, 2015, through June 22, 2015. All participants were enrolled in a US medical resident program.
Percentages within may not always add up to 100% due to rounding.

In 2015, the average resident salary—$55,400—was a slight increase over that reported in Medscape's 2014 Residents Salary & Debt Report ($55,300). The figure averages higher earnings in such specialties as critical care and oncology and lower earnings in other specialties, such as primary care.
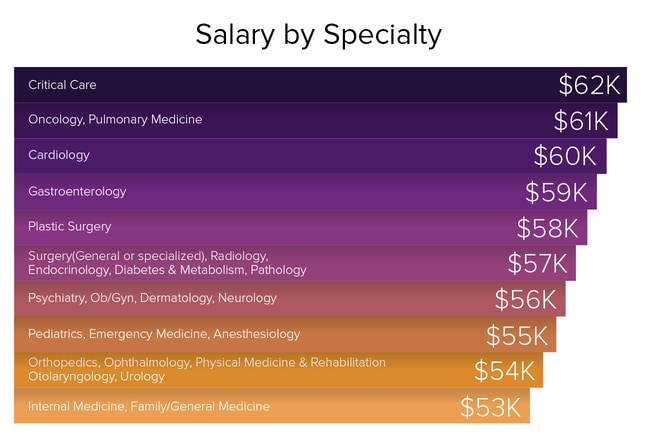
Critical care residents ranked number one in salary ($62,000) in 2015, earning more than their internal medicine and family medicine colleagues, who earned the least ($53,000). Their rankings remain unchanged from 2014. Of note, the three top-paying resident specialties are only in the middle of the pack of salaries for established physicians, according to Medscape's Physician Compensation Report 2015.
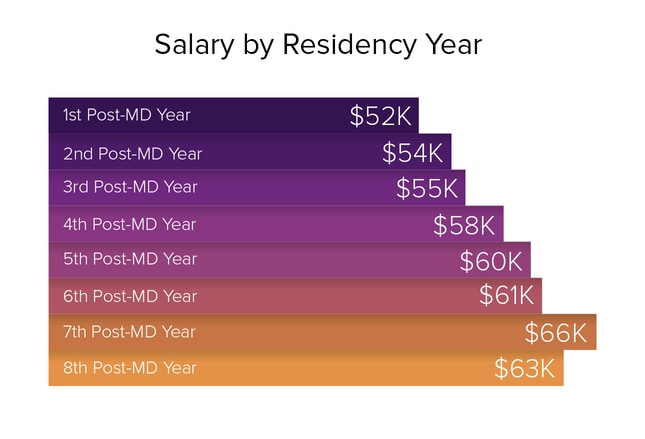
The average resident earned $52,000 in the first year, with salaries increasing to a high of $66,000 by the seventh year. The largest increase was between year 6 and year 7.
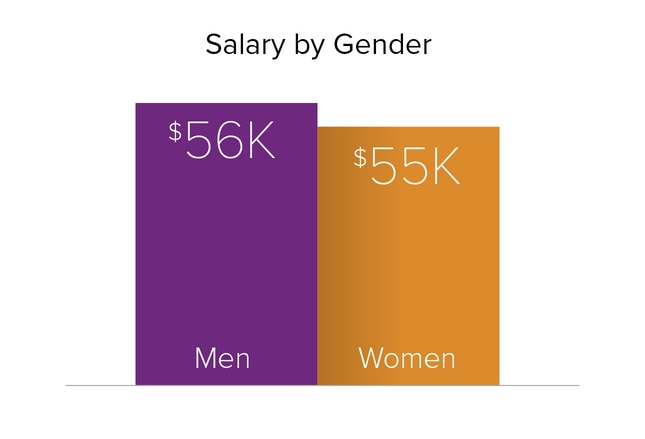
In our 2015 report, male and female residents averaged virtually the same salary ($56,000 and $55,000, respectively). In our 2014 report, the earnings gap was also very minor, with male residents averaging $56,000 and female residents averaging $54,000.

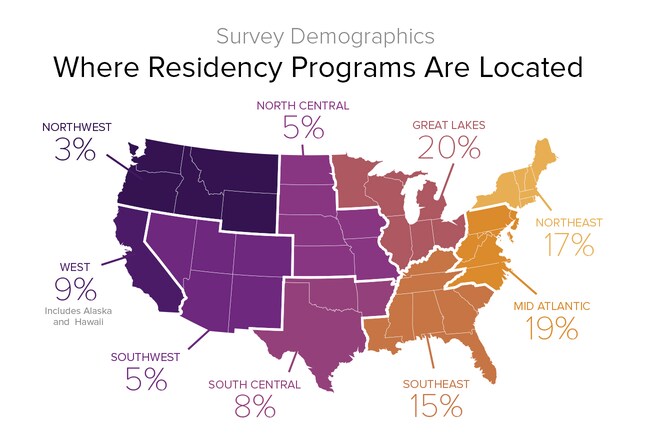
Residents in the Northeast took home the top salaries in our 2015 report, averaging $62,000; in 2014, they earned $61,000, which placed them second. Residents in the Northwest ranked number two in earnings this year, averaging $57,000; however, in 2014, they placed first. Residents in the Southeast earned the least this year and last year ($51,000 and $50,000, respectively), but this bears little relation to their future earning potential. In our 2015 Physician Compensation Report, practicing physicians in the Northwest were the highest earners but their colleagues in the Northeast ranked last, and those in the Great Lakes, North Central, South Central, and Southeast regions were in a neck-and-neck race (within $3000 of each other) for the third-highest compensation.
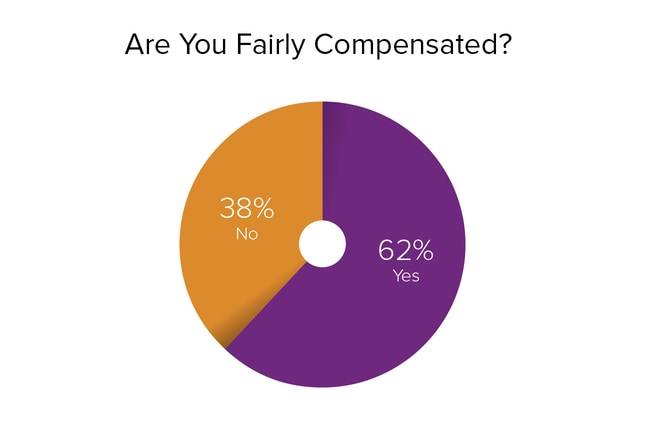
Nearly two thirds (62%) of the residents we surveyed reported that they considered their compensation fair. This is higher than what was reported by practicing physicians; almost one half (47%) of primary care physicians feel fairly compensated, and 50% of specialists feel fairly compensated.
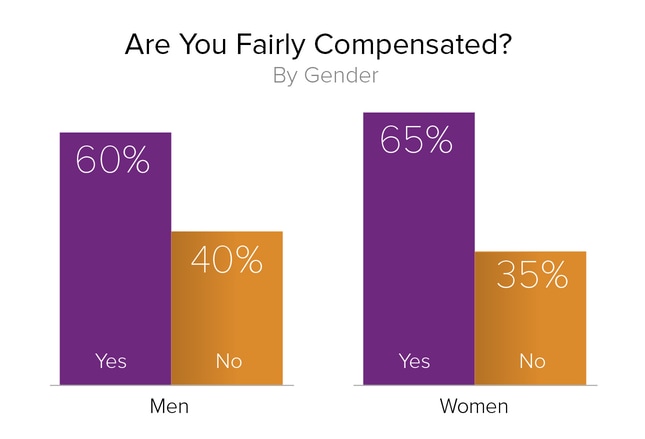
Compensation satisfaction by gender appears to be growing compared with last year. This year, 60% of male residents and 65% of female residents surveyed felt fairly compensated. In contrast, in our 2014 report only 48% of male residents and only 57% of female residents felt the same.
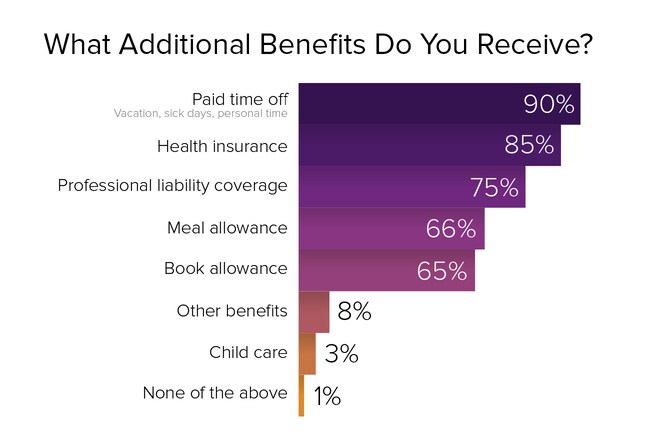
Nearly all residents (90%) get paid time off, including vacation days, sick days, and personal time, and nearly as many (85%) receive health insurance. Most (75%) receive professional liability coverage, and two thirds receive meal and book allowances. Day care allowances remain a rarity; only 3% of residents report receiving them.

"I got into medicine because I want to help people. However, I now have $200,000 in loans to pay off. So, yes, money is now a factor."
"I wanted to enter a specialty where I could do the most good for the most people. Income wasn't really a factor."
"Compensation is not the most important factor, but it is certainly one of the top three."
"Money is obviously important, but I chose my specialty because I enjoy the specialty."
"I don't want to finish nearly 15 years of training, be a decade behind my friends, and still be net-negative for the next decade."
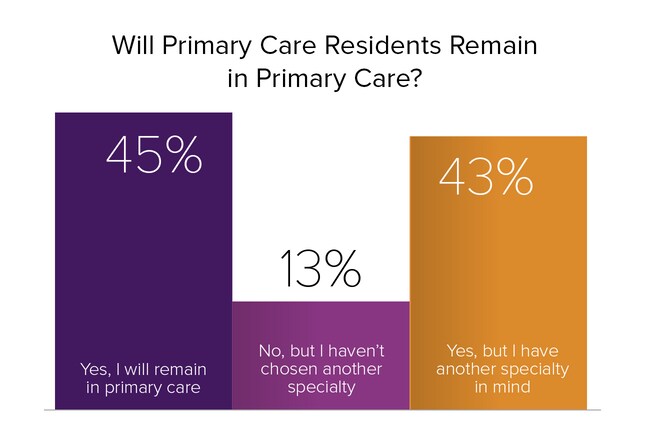
For many residents, internal medicine, family medicine, and pediatrics are natural callings. But there are many factors, including one's own interests, that influence choice of specialties. One factor is future salary. Is the pay high enough to tempt residents to remain in those specialties? In Medscape's 2015 Physician Compensation Report, of 26 specialties surveyed, internal medicine ranked 23rd ($196,000), family medicine ranked 25th ($195,000), and pediatrics ranked 26th ($189,000). This reality was reflected in our 2015 Residents Salary & Debt Report, which found that over one half (56%) of primary care residents plan to switch to other specialties.
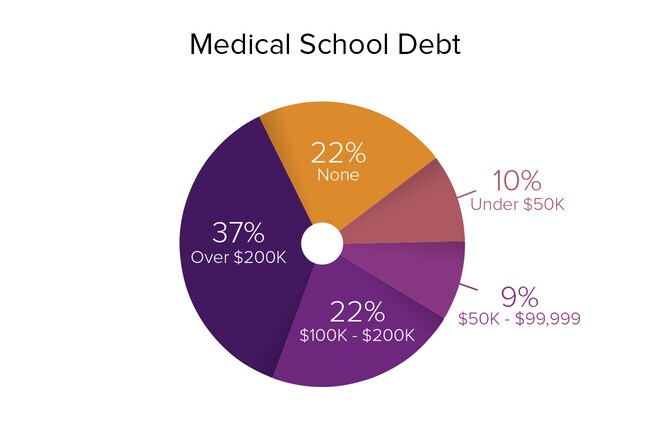
Some 68% of residents have a considerable amount of medical school debt (exclusive of any other debt): $50,000 or more. Well over one third (37%) of residents have over $200,000 in debt, and over one fifth (22%) have $100,000-$200,000. Another 9% have $50,000-$99,999, and 10% have less than $50,000. A fortunate 22% of residents have no debt.
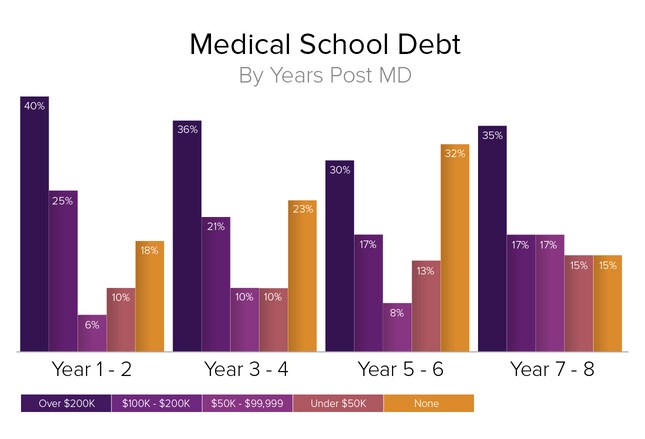
Medical school debt does not change much over the course of the residency period. In our 2015 survey, for example, 40% of residents owed over $200,000 in debt in residency years 1-2, 36% owed that amount in years 3-4, 30% owed that amount in years 5-6, and 35% owed that amount in years 7-8. The percentages of residents who owed over $200,000 in medical school debt over the same periods in our 2014 report were virtually the same.
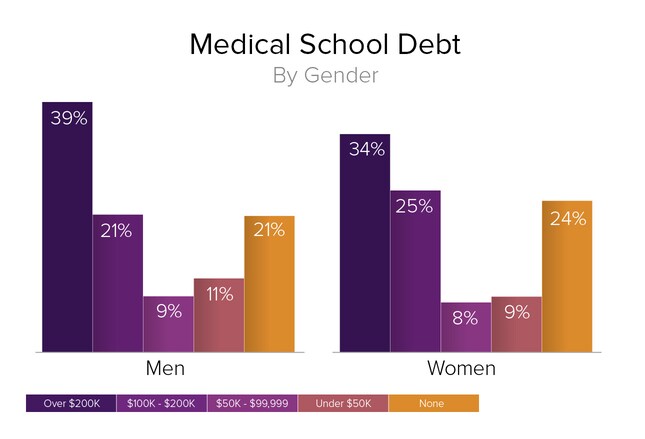
Just as there was practically no difference in the salaries earned by male and female residents, the variation in medical school debt carried by male and female residents is very slight, with 39% of male residents having over $200,000 in debt vs 34% of female residents; 21% of male residents having $100,000-$200,000 in debt vs 25% of female residents; and residents owing $50,000-$99,999 virtually the same for both genders (9% of male residents vs 8% of female residents).

Scut work can include almost anything, from nursing chores to entering patient data into an electronic health record or serving as a scribe. Although this can be a source of resentment—and nearly 20% of our respondents said they had too much scut work—the majority (58%) felt that they had a reasonable balance of tedious chores and more important responsibilities. Over one fifth (22%) of residents surveyed said they hardly did any scut work.
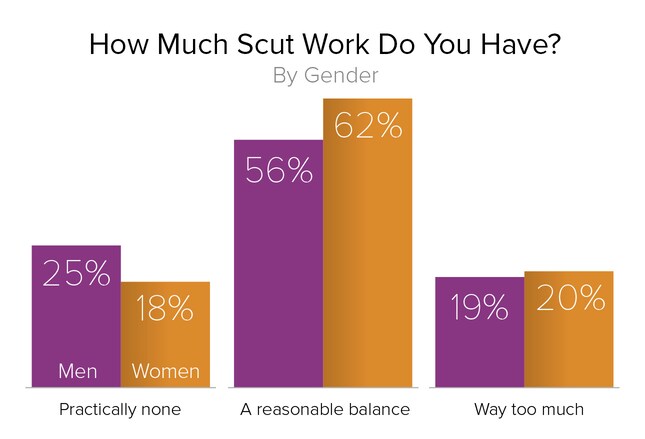
Are female residents given more menial chores than their male counterparts? Not according to the residents we surveyed: 56% of male residents and 62% of female residents believed they had a reasonable balance of scut work and more important duties, and an almost equal number—19% of male residents and 20% of female residents—felt that they had way too much scut work. One quarter of male residents and nearly one fifth (18%) of female residents said they were given practically no menial tasks.
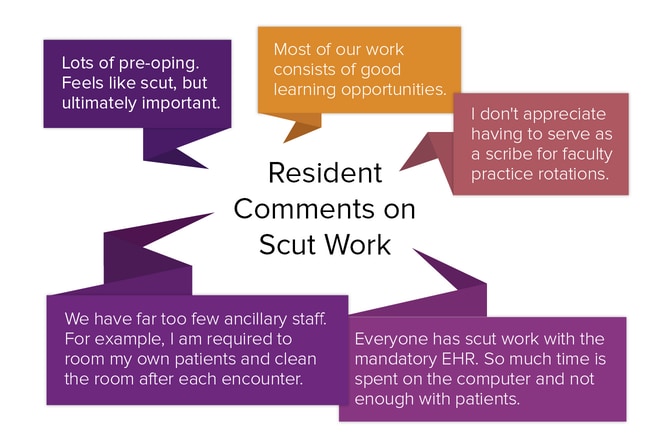
Hundreds of residents offered comments on the scut work they were asked to do. Scut work by definition includes routine, even menial, tasks. But surprisingly, for a large number of respondents, such work was "unavoidable," "needs to be done," "reasonable," "a necessary evil," and "absolutely part of the job."
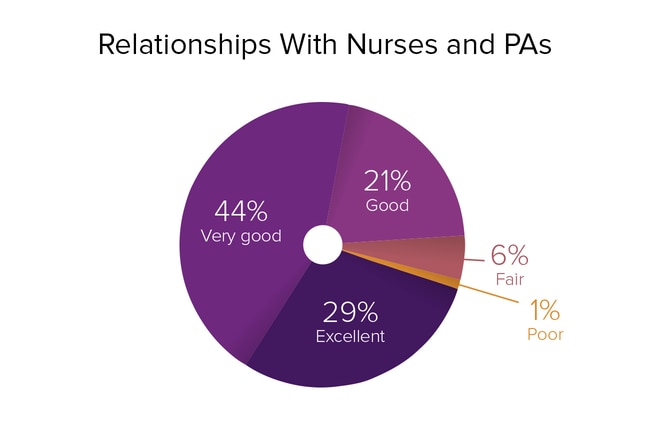
An extraordinary 94% of residents in our 2015 survey rated their relationships with nurses and physician assistants (PAs) as good to excellent. In our 2014 survey, residents' opinion of nurses and PAs was similarly high.
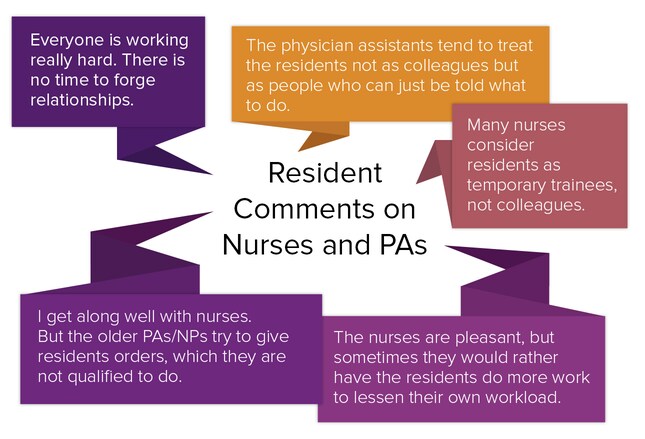
We also asked residents to jot down their comments on their relationships with nurses and PAs. Sometimes people express one opinion in their ratings and another in their comments, but that turned out not to be the case here. Out of more than 1800 responses, which simply stated "good," "very good," or "excellent," slightly over 100 were critical, but they did offer some specifics.
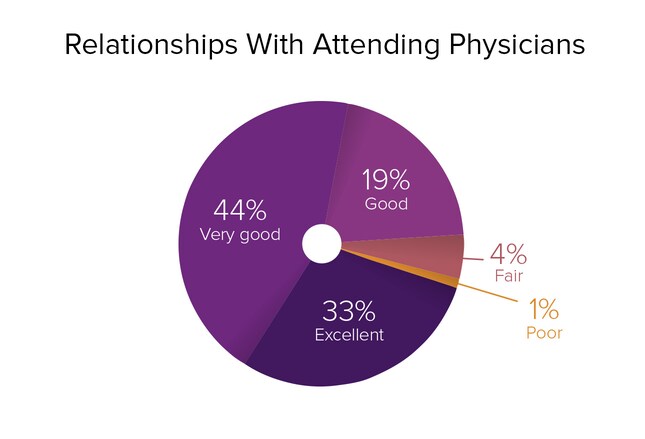
Residents' relationships with attending physicians are quite positive, according to our latest survey, with 96% of respondents rating them good to excellent. In our 2014 survey, nearly all of the respondents (94% of male residents and 95% of female residents) reported that their relationships with attendings were good to excellent as well.
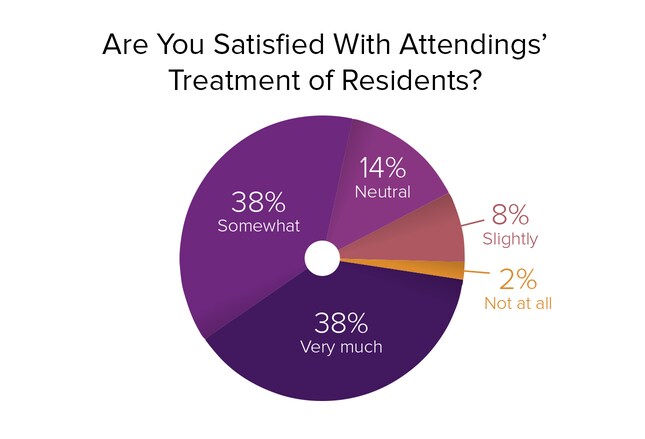
"While most attendings are fine, a few have a dismissive or poor attitude toward residents."
"A lot of behavior is allowed that would be considered unprofessional in any other workplace."
"Although it has improved during my residency, the attendings typically do very little work themselves, leaving far too much of the work to the residents."
"Attendings rely on residents to complete almost all of the practical work for patient care. But we are at their mercy should anything go wrong with patient care."
"Some attendings belittle us, curse at us, yell at us, don't teach, are unreasonable, and promote a negative work culture. Others are fantastic to work with, patient, great teachers, and knowledgeable."
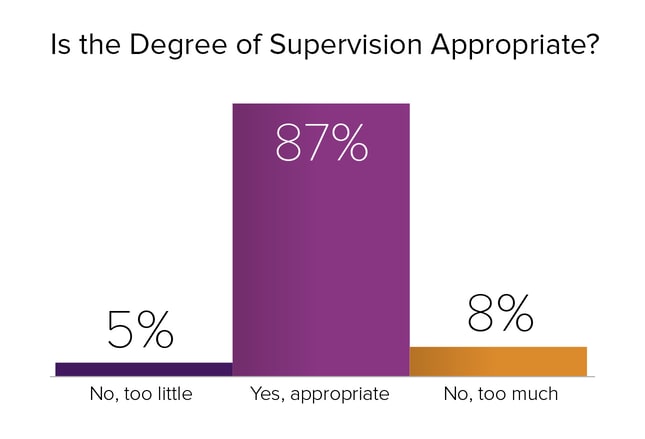
Although some residents voiced concerns about the lack of supervision by attending physicians, the vast majority of our respondents (87%) believed that their degree of supervision was appropriate. Only 5% felt that they received too little supervision. Another 8% were of the opinion that they received too much.

"Clinical teaching is the most critical part of residency. You can always read, but you will never have the opportunity to learn under the direct supervision of an attending. In my residency, it's lacking."
"Attending presence is limited. Most didactic teaching is being done by other residents, not attendings. There aren't enough residents, and the case load is too heavy and documentation takes up too much time for much teaching."
"Attendings are no longer compensated for academic time, so they've stopped giving lectures."
"Our attendings are invested more in their practices than in resident education."
"Our medical education tends to be random. There is no logic to how lectures are structured. Every day we get a different random topic. We miss the big picture."
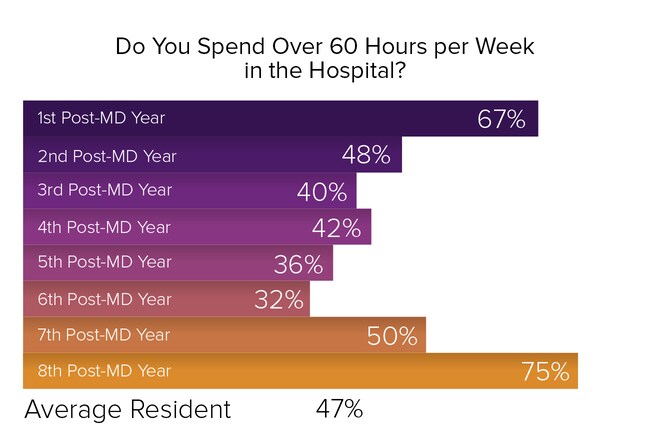
The percentage of residents who spend over 60 hours per week in the hospital roughly traces a U-shaped curve: 67% of first-year residents, 48% of second-year residents, 40% of third-year residents, 42% of fourth-year residents, 36% of fifth-year residents, and 32% of sixth-year residents do so. Then the curve begins to climb again, with 50% of seventh-year residents spending over 60 hours per week in the hospital, and 75% of eighth-year residents following suit. This may be because of lengthier surgical residencies, which are hospital-intensive, or because lengthier residencies may involve research conducted at academic medical centers.
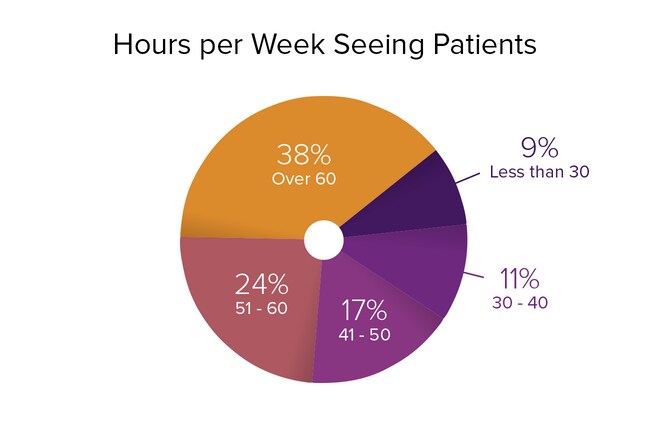
In our 2015 survey, 79% of residents spent over 40 hours per week seeing patients. Of these, 38% spent over 60 hours per week on patient care, 24% spent 51-60 hours, and 17% spent 41-50 hours. Another 11% of residents spent 30-40 hours seeing patients, and 9% spent less than 30 hours on patient care.
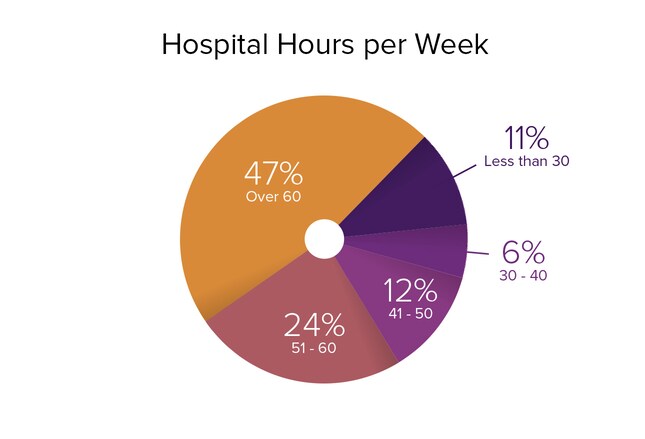
Nearly one half (47%) of residents we surveyed this year work over 60 hospital hours per week, and nearly one quarter (24%) work 51-60 hours. But thereafter, the percentages fall off dramatically. Only 12% of residents work 41-50 hours in the hospital, 6% work 30-40 hours, and 11% work less than 30 hours.
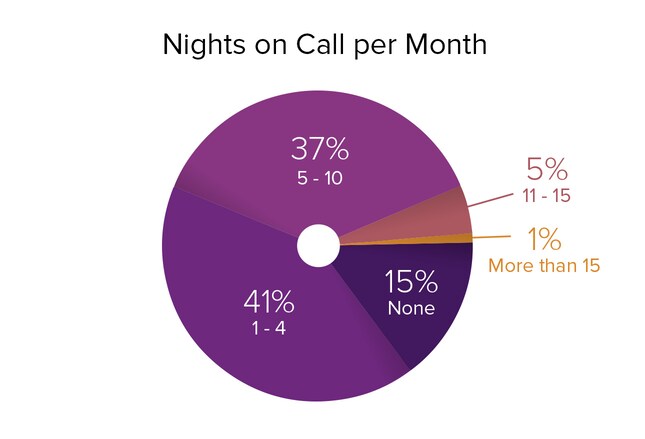
Forty-one percent of residents are on call one to four nights per month, and over one third (37%) are working nights five to 10 times per month. Another 5% have call 11-15 times per month; 1% work more than 15 nights per month; and 15% don't have night call. These percentages virtually mirror those of our 2014 survey results.
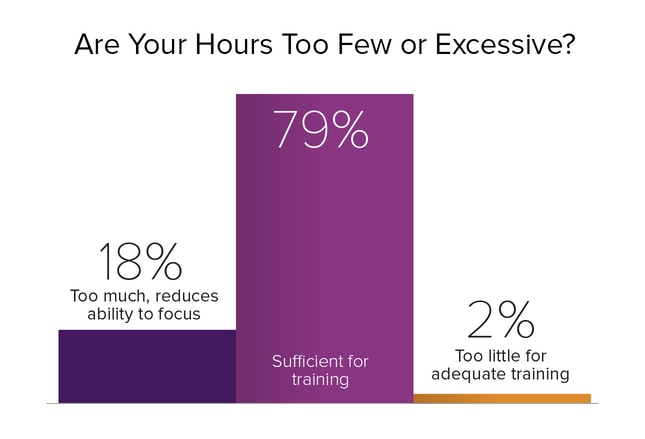
"I have enough time for an appropriate personal vs professional life balance for this stage of my training."
"I'm busy, but usually not so busy that I'm too tired to function."
"I'm getting more than adequate experience, with approximately five to six 24-hour call days per month."
"Our program does 12-hour shifts. Doing 12 hours at a time is too much and eliminates any productivity for the rest of the day."
"I would burn out if I worked any more than I already do."
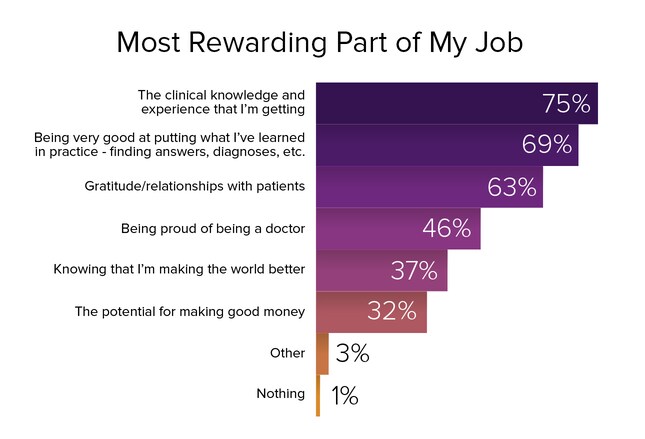
Not surprisingly, 75% of residents found the clinical knowledge and experience that they are getting to be the most rewarding part of their jobs, given that the most important part of their jobs as residents is to learn. In second place, with 69% of the vote, was "Being very good at putting what I've learned into practice." A close third, according to 63% of the respondents, was "Gratitude/relationships with patients." "Proud of being a doctor" ranked fourth (46% of residents cited it). As for the potential for making good money, it ranked near the bottom, with fewer than one third (32%) of residents citing it as the most rewarding aspect of the job.
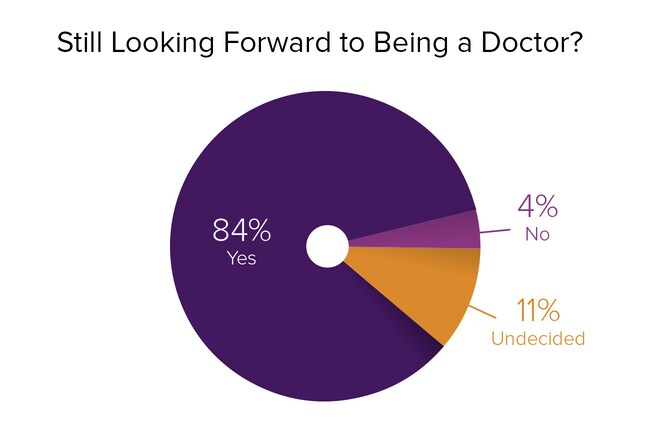
Many practicing physicians believe that medicine is rife with problems and frustrations. And residents are far from starry-eyed optimists: Only 37% ranked "Knowing that I'm making the world a better place" the most rewarding part of their jobs. But despite all of the complaints they've probably heard from practicing physicians, fully 84% of residents are still looking forward to being a doctor. Only 11% are having second thoughts, and only 4% feel that they made the wrong career choice.
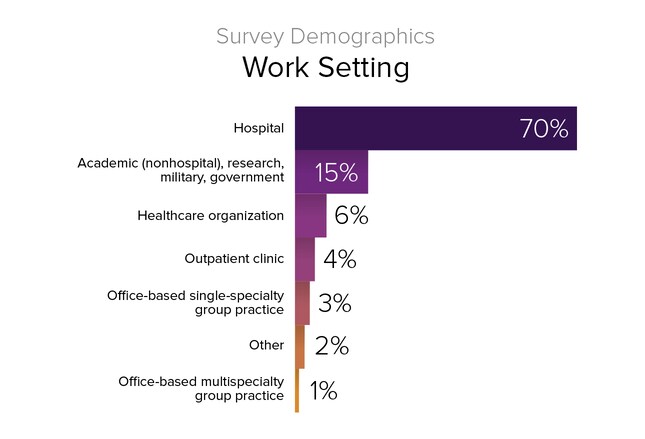
Most residents (70%) work in hospital settings. Although serving in the military or an underserved area can reduce medical school debt, it's an option that few residents choose. Similarly, graduate medical education funding is available for community-based teaching sites, which is intended to produce more primary care physicians. But with more than one half of primary care residents looking to switch to more lucrative specialties, this opportunity currently has few takers.
.
All material on this website is protected by copyright, Copyright © 1994-2015 by WebMD LLC. This website also contains material copyrighted by 3rd parties.




No comments:
Post a Comment
Please leave a comment-- or suggestions, particularly of topics and places you'd like to see covered